
Contents
- Basics
- Avoid common beginner mistakes
- Choosing a self-service BI solution
- Limitations of self-service BI
- When self-service BI fits well, and when it does not
- Three concrete examples of self-service BI
- Adoption & governance
- Workflow: start in 4 steps
- Frequently asked questions about self-service BI
- Conclusion
Key takeaways
- Self-service BI enables business teams to create and adapt recurring analyses within clear guardrails.
- Current, understandable metrics can speed up decisions; their value depends on the data foundation, definitions, and use.
- The BI cycle helps teams review bottlenecks, opportunities, and trends regularly.
- Successful implementation needs clear guardrails: governance prevents KPI sprawl and data silos.
Self-service business intelligence enables business teams to create or adapt recurring analyses and dashboards with less dependence on centrally produced reports. It still requires accessible data, understandable metric definitions, and an appropriate role and permission model.
IT, data, or platform owners remain important: they secure integrations, data quality, governance, and operations. How current an analysis is depends on the refresh interval of each source.
Flexible visualization and filtering options provide the depth you need. Role-based access controls make it possible to limit access so that certain data is only available to selected team members—or even to customers.
How much did we spend on Campaign X last quarter? Was investing in Channel Y worth it? What can we learn from both—and use for future budget decisions? With self-service BI, marketing can answer these questions on its own instead of waiting for an IT report.
This article is aimed at freelancers and companies who want to benefit from self-service BI. It explains how it works, what typical pitfalls to watch out for, and how to get started.
Basics
What self-service BI really means
Today, every company that uses software has access to data from a wide range of platforms: accounting software, CRM systems, marketing tools. In addition, there are internal spreadsheets, external data (e.g., for marketing analytics), and much more.
Often, this data can only be accessed individually across different tools and storage locations—rather than being available centrally in a way that can be visualized and analyzed.
A self-service business intelligence solution helps connect, visualize, analyze, and share this data in one application. Business teams can handle many recurring changes without opening a new IT request each time.
Role and permission systems govern who can access and change which data. An approachable interface can lower the learning curve, but it does not replace onboarding or knowledge of the underlying data and metrics.
Why self-service BI makes sense right now
In many organizations, data volume and the number of data sources continue to grow. At the same time, requirements change faster and faster. Under these conditions, simple and consistent analysis processes make sense—so data can be used economically.
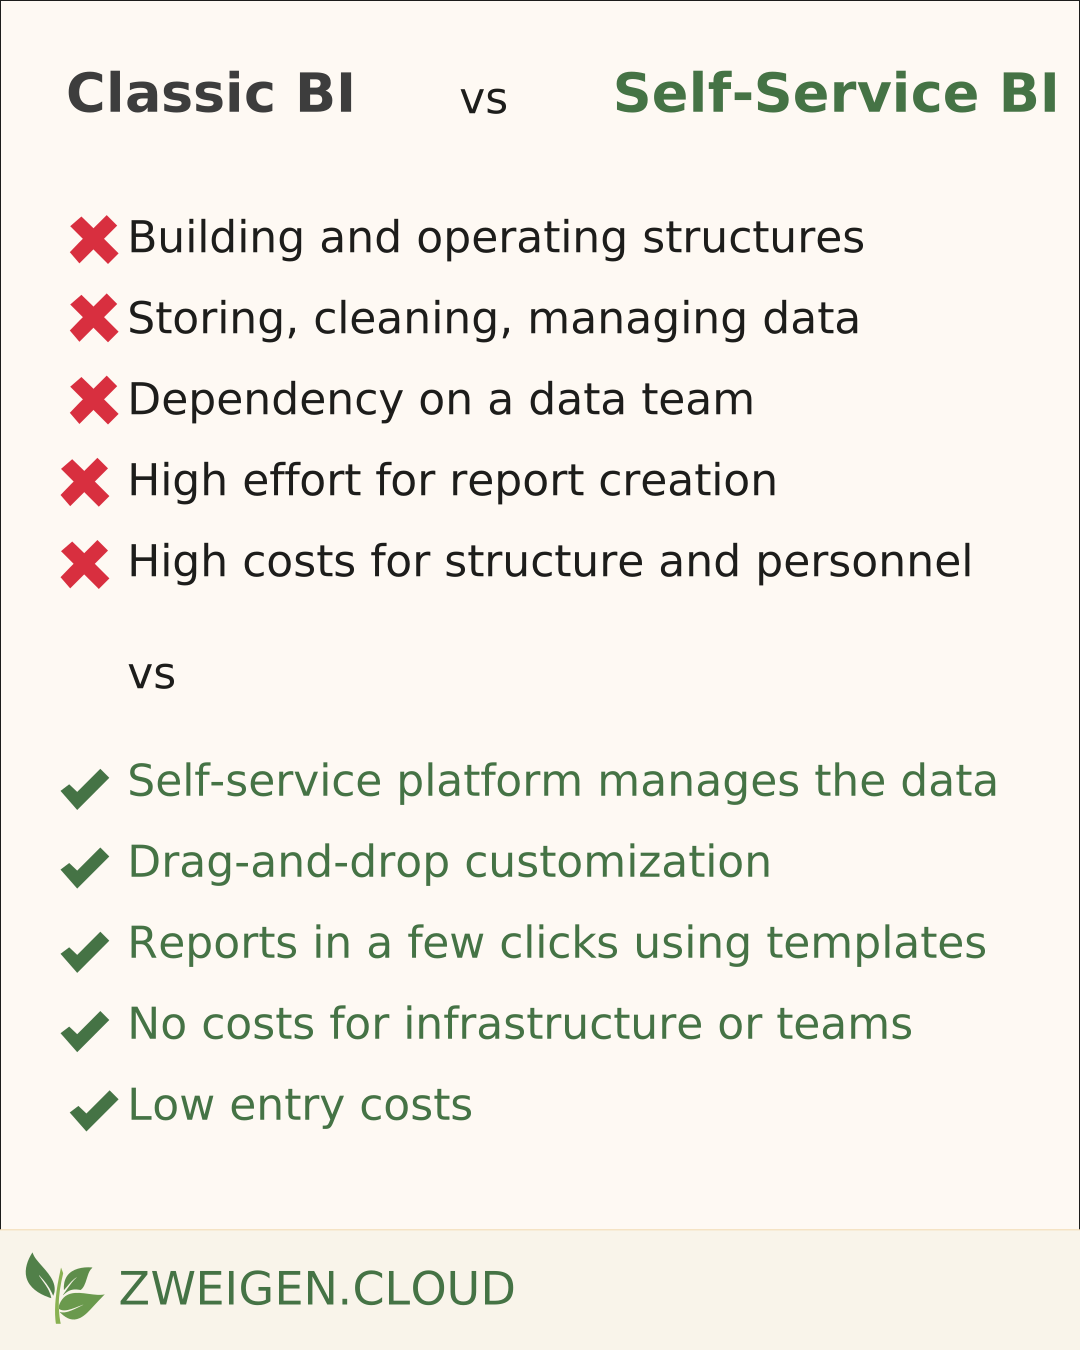
Classic BI delivery models—where the IT department stores, cleans, and builds reports on request—can still be valid. But they often fail to provide the agility needed when requirements change frequently.
Self-service BI platforms differ substantially. Some combine data integration, storage, and visualization, while others depend on an existing data platform. Cost and operational effort should therefore be assessed against data volume, integrations, governance requirements, and available skills.
Avoid common beginner mistakes
Self-service BI creates real productivity gains, but without guardrails it can produce the opposite effect. The most common problems:
Report chaos and KPI inconsistencies
If everyone defines their own metrics, you end up with different versions of the same metric. Reporting without clear goals—and working without professional templates—can slow down progress.
Solution: central metric definitions for the team. Best practices for professional dashboards (see Build effective dashboards) should be followed. Templates prevent these problems from the start and also save time.
Missing alignment and missing training
Templates and guided setup can accelerate onboarding. Without shared rules, however, the freedom these tools provide can lead to duplicated work or conflicting reports.
Free-form design instead of templates—or duplicated work—can happen when teams simply start without alignment.
Solution: clear responsibilities within the team. Who owns which dashboards and numbers? A shared onboarding of the software. An overview of which features exist and which ones should be used together.
Missing data structures
If the software tools a company uses do not allow exporting data, a self-service application cannot visualize that data either.
Solution: automated data transfer—or at least export via .xlsx or .csv—should be a selection criterion for any business software.
Choosing a self-service BI solution
Data can be connected easily
Ideally, BI software offers many native integrations to common platforms: Google Analytics, HubSpot, SevDesk, LinkedIn Ads, and so on. That means data can be made available with just a few clicks.
In addition, there is often internal data from internal systems or manually maintained sources. Ideally, there should also be a way to connect and/or upload this data.
Storage and preparation of data
Many large BI applications act only as visualization tools. They are designed to display data that you already manage yourself.
The boundary depends on the product. Teams should verify who is responsible for storage, cleaning, data quality, refreshes, and performance. Those responsibilities do not disappear when a platform automates part of the work.
Templates for dashboards and reports
The structure and content of dashboards are crucial for the value they provide. Professional templates remove this hurdle and save a great deal of time.
Because requirements differ, templates should be easy to adjust when needed—but the foundation should be well thought out and immediately usable.
Role management and easy sharing
Business data has different stakeholder groups. It should be easy to share dashboards internally and externally.
In addition, there should be a way to reserve sensitive data and certain actions for specific users. A simple role model based on the “least privilege” principle (only the minimal required permissions) protects against data leakage.
Limitations of self-service BI
Self-service BI is strong when teams need fast, reliable answers. But there are typical limitations where additional roles, processes, or a stronger data platform become necessary:
- Complex data models and custom logic: Many edge cases, forecasting logic, or strict modeling requirements usually require a semantic layer and clear ownership.
- Data quality and trust: Self-service often fails because of missing definitions, tests, and monitoring — not because of the tool.
- Permissions, audits, compliance: The more sensitive the data and the larger the team, the more important roles, approval flows, and logs become.
- Performance at scale: For very large volumes or near real-time requirements, you typically need a data warehouse, aggregations, and caching strategies.
Pragmatically: start with self-service, but add guardrails early (KPI definitions, ownership, access model). Once a domain hits limitations repeatedly, professionalize the data and governance building blocks for that domain.
When self-service BI fits well, and when it does not
Self-service BI is especially strong when teams need to answer similar questions regularly, data sources are already available, and there is a shared understanding of the metrics.
Self-service BI is a good fit when:
- business teams work with the same data sources regularly,
- metrics are clearly defined,
- teams need to filter, compare, and segment data,
- decisions need to be made quickly.
Self-service BI is often not enough on its own when:
- data from many systems first has to be harmonized with substantial effort,
- definitions vary widely between teams,
- governance, access rights, or data quality are unresolved,
- highly customized analysis or complex data models are required.
In those cases, you additionally need clear governance rules, a data inventory, or a stronger data platform. Even then, self-service BI can still remain the core of day-to-day usage.
Three concrete examples of self-service BI
Marketing: A team compares weekly cost, leads, and pipeline contribution by channel without manually stitching together data from ads, CRM, and web analytics each time.
Sales: Leads, pipeline, and conversion rates are filtered by team, source, and region so bottlenecks can be addressed faster.
Finance and leadership: Revenue, costs, and liquidity become centrally visible so deviations can be identified early and prioritized properly.
Adoption & governance
Who is self-service business intelligence relevant for?
Self-service BI is especially relevant for people who work repeatedly with the same metrics and derive decisions or recommendations from them.
Whether someone needs direct access depends on their task, data needs, and permissions. Not everyone needs every analysis feature or dataset.
Concrete examples:
- Executives: Recurring reports from different areas can be combined in one filterable view with a visible data refresh status.
- Marketing: A consolidated overview across all sources. No switching between platforms, no manual compilation of data, and no time-consuming comparisons across sources or time ranges.
- Agencies: Customers get their own access and can access and filter their data at any time.
- Controlling: Refreshed views of inflows, outflows, budget spend, and deviations support regular review.
Self-service BI not only makes it possible to make better decisions independently, but also to validate those decisions with internal or external stakeholders.
Best results as a company culture
Business intelligence is much more than a tool. Outcomes and outcome drivers can be made visible for everyone. Everyone can get visibility into the outcomes that should be improved. Goals become more tangible and successes more traceable.
Decisions are made based on facts, not gut feeling. The outcomes of these decisions become visible and form the basis for new decisions. Work processes align around optimizing those outcomes.
This requires clear responsibilities for data, rules for access and use, and a culture of transparency.
A minimal role setup that works even in smaller organizations
-
Domain owner: Owns goal-setting, implementation, and communication. This person is responsible for steering, optimization, and reporting. Example: the head of sales is the owner for all sales data.
-
Platform owner: Helps with questions about the BI application and data integration. Connects new data sources, manages permissions, and provides general support around the tool.
-
Team members: Get visibility into the numbers for their area and work together with the domain owner to reach the goal.
The goal is not for everyone to make everything visible. Clear ownership ensures that the right people know about the important data, KPIs, and their development.
Start with manageable sub-projects. Transparent communication with the team matters.
Consider privacy and security from the start
As soon as personal data or sensitive company data comes into play, self-service BI quickly becomes a formal topic.
For the EU/Germany, GDPR is central. Important principles:
-
GDPR and software: privacy must be anchored in the BI software you use. Default settings should be configured accordingly by the platform owner.
-
Least privilege: each user receives only the minimal required permissions. Access to sensitive data is strictly controlled and logged in an auditable way.
Workflow: start in 4 steps
Plan and build the data foundation
Plan goals, responsibilities, dashboards, and KPIs.
Pick 1–3 concrete processes that should improve. Name owners as well as the required dashboards and KPIs to monitor.
What are the most important business processes? Where do we already have data? Where is data already being used? Where can data best support decisions? Where are important decisions often made? Where does decision quality have the biggest impact?
Questions like these help identify the areas with the highest value from self-service business intelligence.
Start small
Smaller pilot projects help identify early hurdles and plan for them as you scale.
It’s recommended to accompany the process for a few weeks: clarify questions, guide usage, and optimize before rolling out broadly.
Optimize
After the initial setup, you can and should continue observing both the application and the processes behind it—and adjust as needed.
Users should be involved directly in optimization. They know best where the process breaks down or which KPIs they are missing—or don’t need.
Scale through reuse
After early success, there are several directions to expand: broader data capture, more data sources, more access, more business areas. In addition, automated reports can be sent or notifications for specific events can be set up.
Defining clear goals (e.g., reduce costs in process X by Y%, increase customer satisfaction in area Z) helps you find the right business-intelligence strategy and make success measurable.
Frequently asked questions about self-service BI
Is self-service BI the same as self-service analytics?
Not quite. Self-service BI is usually more focused on operational metrics, dashboards, and recurring evaluations. Self-service analytics can be more exploratory and go deeper into root-cause analysis.
What is the biggest mistake in self-service BI?
Giving teams too much freedom too early, before the data structure, terminology, and responsibilities are clearly defined. Without guardrails, KPI sprawl quickly replaces clarity.
What does self-service BI require?
What matters less than the tool name is the combination of a clean data foundation, clear KPI definitions, and an interface that business teams will actually use.
Conclusion
Reliable access to sufficiently current KPIs can speed up decisions. Self-service BI shortens many recurring analysis paths when the data foundation, permissions, and metric definitions are clear.
Business intelligence makes data usable for decisions. Whether it produces better outcomes depends on how carefully teams interpret the data, choose actions, and review their impact.
It’s recommended to start small where the impact is highest. If successful, expand step by step—but always keep an eye on governance, data quality, and data security.
This way, self-service BI can create lasting value without producing KPI sprawl or uncontrolled data access.
All Data. One system.
Contact
Paul Zehm
Founder at Zweigen